Darkstat is a network statistics gatherer.Effectively, it’s a packet sniffer which runs as a background process on a cable/DSL router, gathers all sorts of useless but interesting statistics,and serves them over HTTP.
Install Darkstat in Ubuntu
sudo apt-get install darkstat
This will complete the installation.Once you finish the installation you need to edit the the file located at /etc/darkstat/init.cfg
sudo gedit /etc/darkstat/init.cfg
# Turn this to yes when you have configured the options below.
START_DARKSTAT=no
to
START_DARKSTAT=yes
Now you need to start the darkstat using the following command
sudo /etc/init.d/darkstat start
This will start the darkstat process
Now if you want to see your network stats go to http://youripaddress:666
Darkstat Screenshots
Here you can see some of the screenshots for darkstat
Once you open the http://youripaddress:666 you should see the following screen

Hosts Screen
Hosts screen you can see all the machines which take part in the communication. These can be arranged by the caused traffic or their particular IP address.

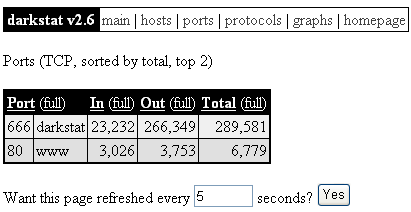
Ports Screen
Ports Screen you can see the port numbers which are used by server and client applications. You can immediately recognize the port numbers which are used by the following daemons: 666 (darkstat), 80 (http)
Protocols Screen
Protocols Screen protocols ICMP,TCP,IGP and UDP for the file transmission, which were involved in the communication event.

Graphs Screen
Graphs Screen screen shot shows a summary of the collected time periods as graphs

This tool is really useful if you want to check your ubuntu system traffic details like incoming and outgoing ports and communication to outside world
There are other tools which you can use as follows
Wireshark (Old Name Ethereal)
Wireshark® is used by network professionals around the world for troubleshooting, analysis, software and protocol development, and education. It has all of the standard features you would expect in a protocol analyzer, and several features not seen in any other product. Its open source license allows talented experts in the networking community to add enhancements. It runs on all popular computing platforms, including Unix, Linux, and Windows.
If you want to install wireshark in ubuntu use the following command
For Ubuntu Edgy users
sudo apt-get install Wireshark
For Ubuntu Dapper Users
sudo apt-get install ethereal
If you want to open go to Applications—>Internet—>Wireshark (If you want run as root select root option)

Once it opens you should see the following screen

If you want to see the available interfaces for capture click on the icon bottom of the file tool option

Capture Network Interface eth0 details

Wireshark Version Details

Etherape
EtherApe is a graphical network monitor for Unix modeled after etherman. Featuring link layer, ip and TCP modes, it displays network activity graphically. Hosts and links change in size with traffic. Color coded protocols display.
It supports Ethernet, FDDI, Token Ring, ISDN, PPP and SLIP devices. It can filter traffic to be shown, and can read traffic from a file as well as live from the network.
If you want to install Etherape in ubuntu use the following command
sudo apt-get install etherape
If you want to open go to Applications—>Internet—>EtherApe(as root)

Once it open the application you can see the network activity with all the protocols and locations

Ethstatus
Console-based ethernet statistics monitor.Ethstatus is a console-based monitoring utility for displaying statistical data of the ethernet interface on a quantity basis. It is similar to iptraf but is meant to run as a permanent console task to monitor the network load.
Install Ethstatus in Ubuntu
sudo apt-get install ethstatus
If you want to see your your network card status from command line just enter the following command
ethstatus
you should see the following screen with all the details

the default pot number for darkstat is 667. No wonder I couldn’t make it work. Citing the documentation:
-p port
Bind the web interface to the specified port. The default is
667.
Also consider ntop and iftop.
These are indispensable.